Optimising a Deep Learning app in Swift
10 Aug 2024I made an app!
Big woop, right? 😁 Well, I’m pretty proud of it.
We won a grant to get a year-long project funded at work (big up Strathwide 2023). The project was centred around improving methods for analysing microscope images. These images are of pharmaceutical particles and the goal is to identify them and characterise their size. Enter, deep learning. Object detection models like Mask R-CNN are widely used for this. We annotated images and trained models and discussed strategies for improving the results… and eventually were pretty happy with it.
One of the deliverables we promised was an easy to use app for performing microscope image analysis. I built a proof-of-concept web app using Python and FastAPI for the backend with some HTML and Javascript on the frontend. Images were captured from microscopes attached to the client and sent to the server for analysis. We used this web app to teach other researchers about our work and it was well received.
With the PoC out of the way, and a conference presentation on the horizon, I started work on an iPad app. (Those new M4 chips should be suitable to run our IA model.) Long story short, the takes in an image (from the photos app or from a camera) and runs Ultralytics YOLO on it to detect objects. Results are marked on the image as superimposed masks and the size of the objects is displayed in a chart.
There was a problem: analysis of a single image took nearly a full second.
Information gathering
Should the model take that long to run?
The model is Ultralytics YOLOv8 (for segmentation, large version). This model takes very little time to run on GPU, but on CPU (e.g. my i5) it begins to approach the 1 second mark. Maybe this is just the performance that can be expected? Xcode doesn’t think so.
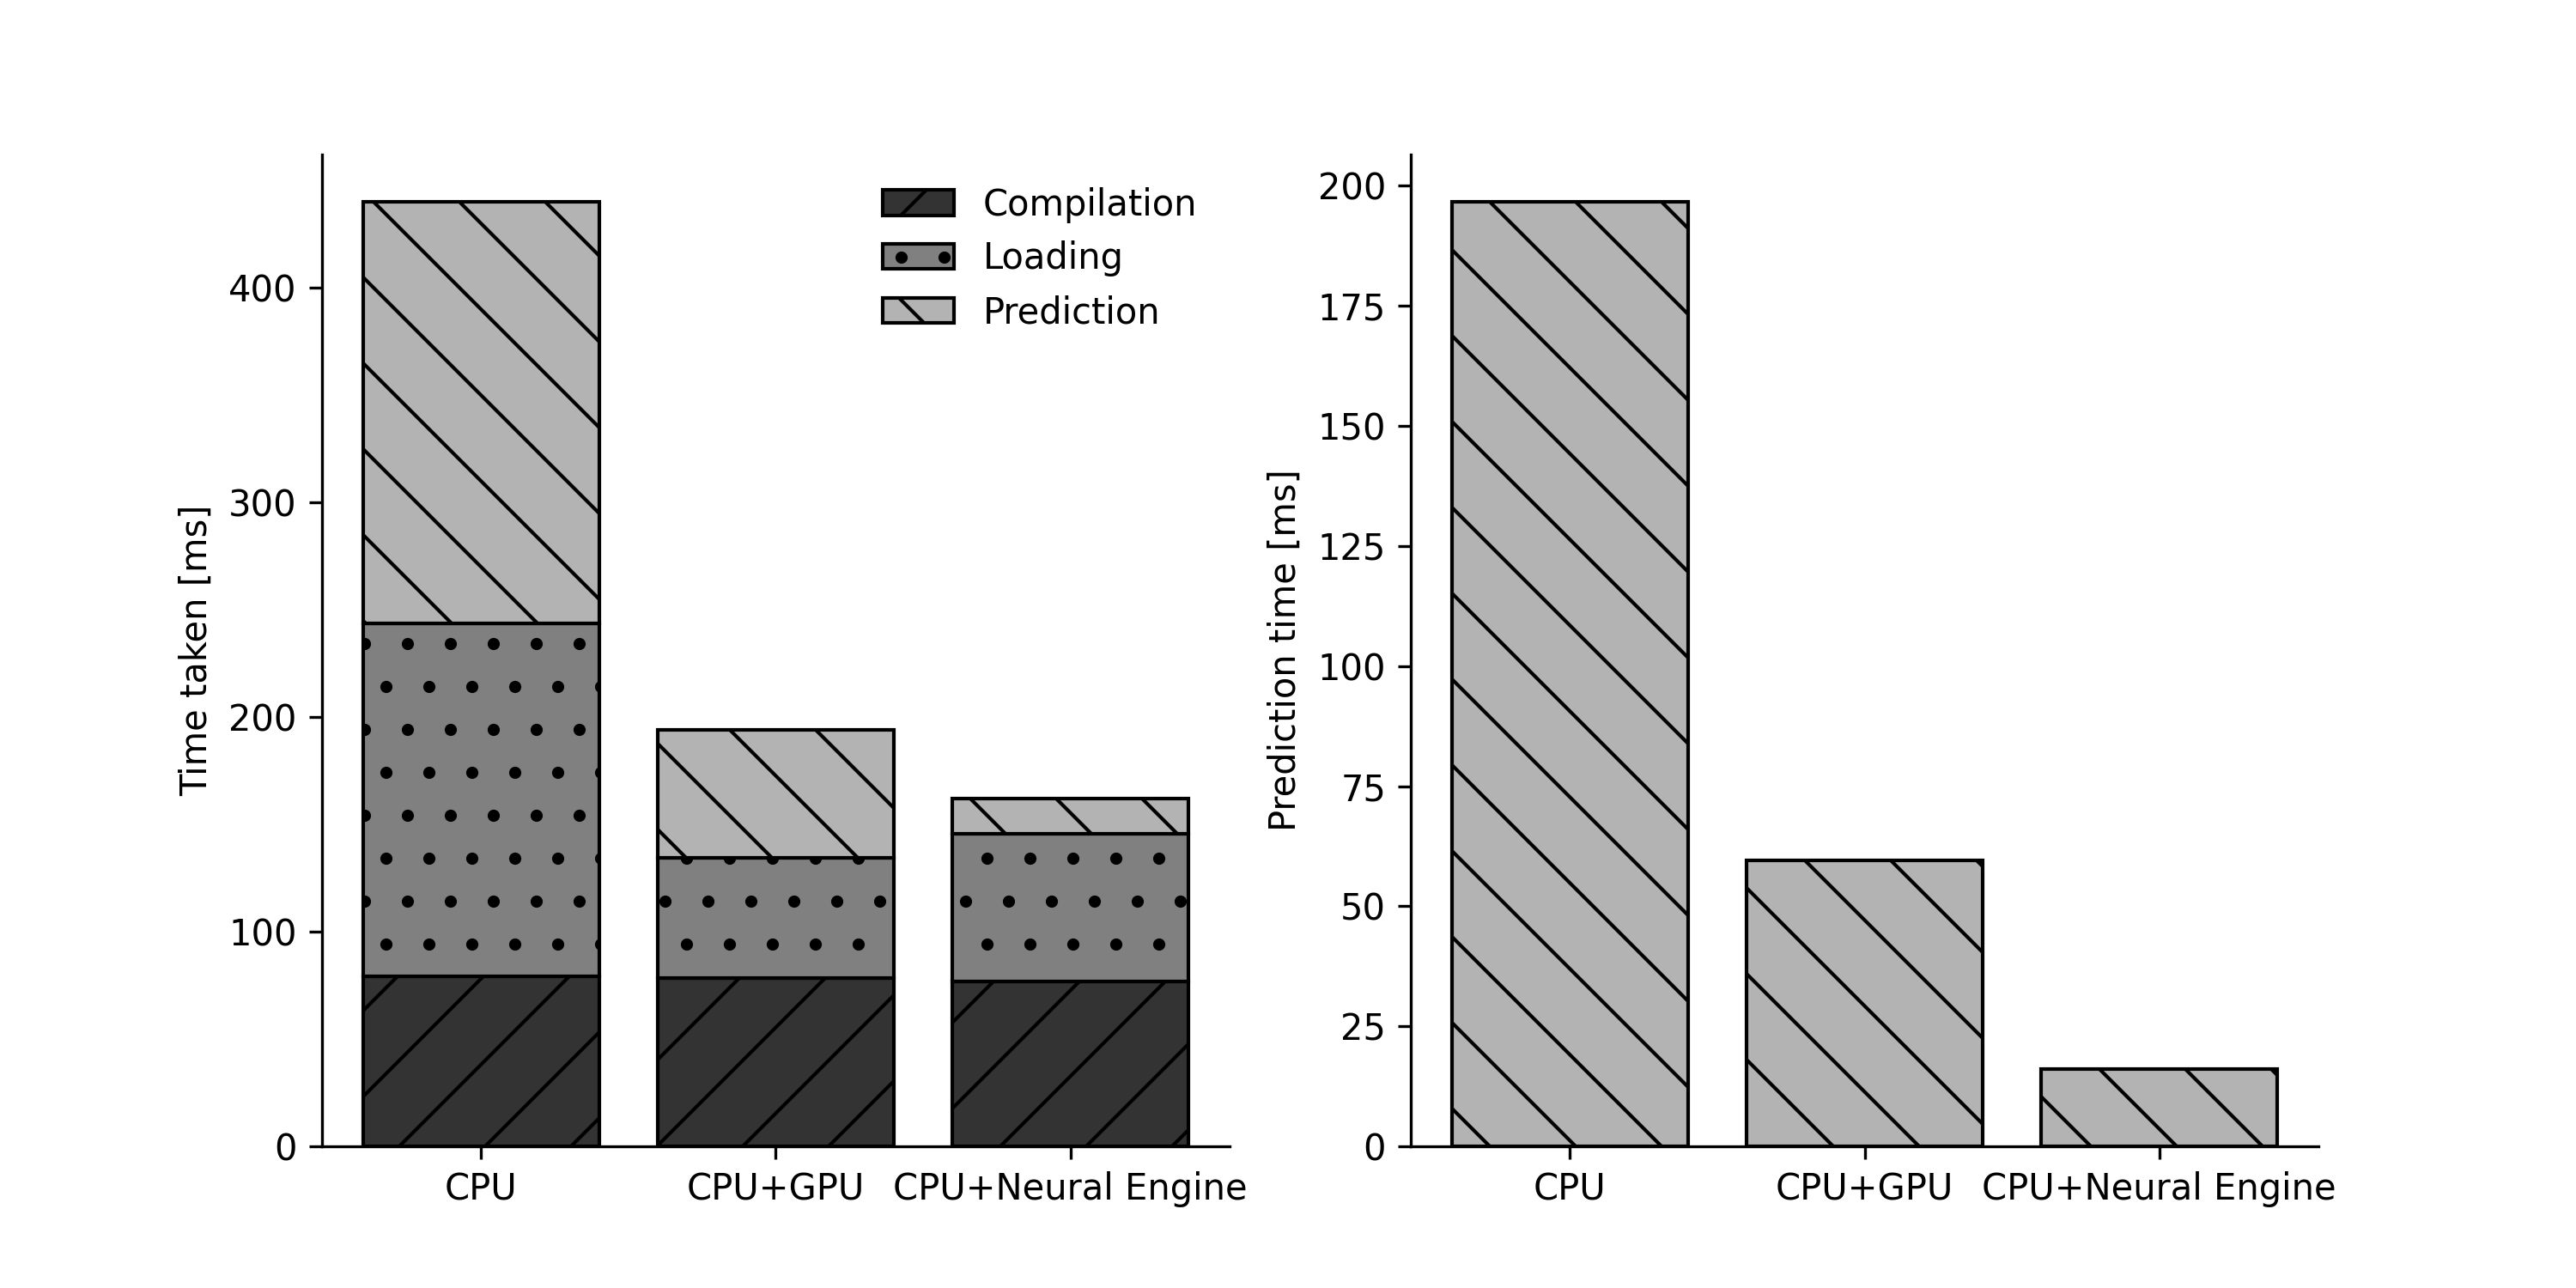
Xcode has a handy wee benchmarking tool built in. If you load a CoreML package, you can run a test to see how fast it will perform on each compute unit (CPU, CPU+GPU, CPU+Neural Engine). I ran this benchmark for each compute unit and got the below:

YOLOv8l-seg benchmarking results on iPad Pro M4
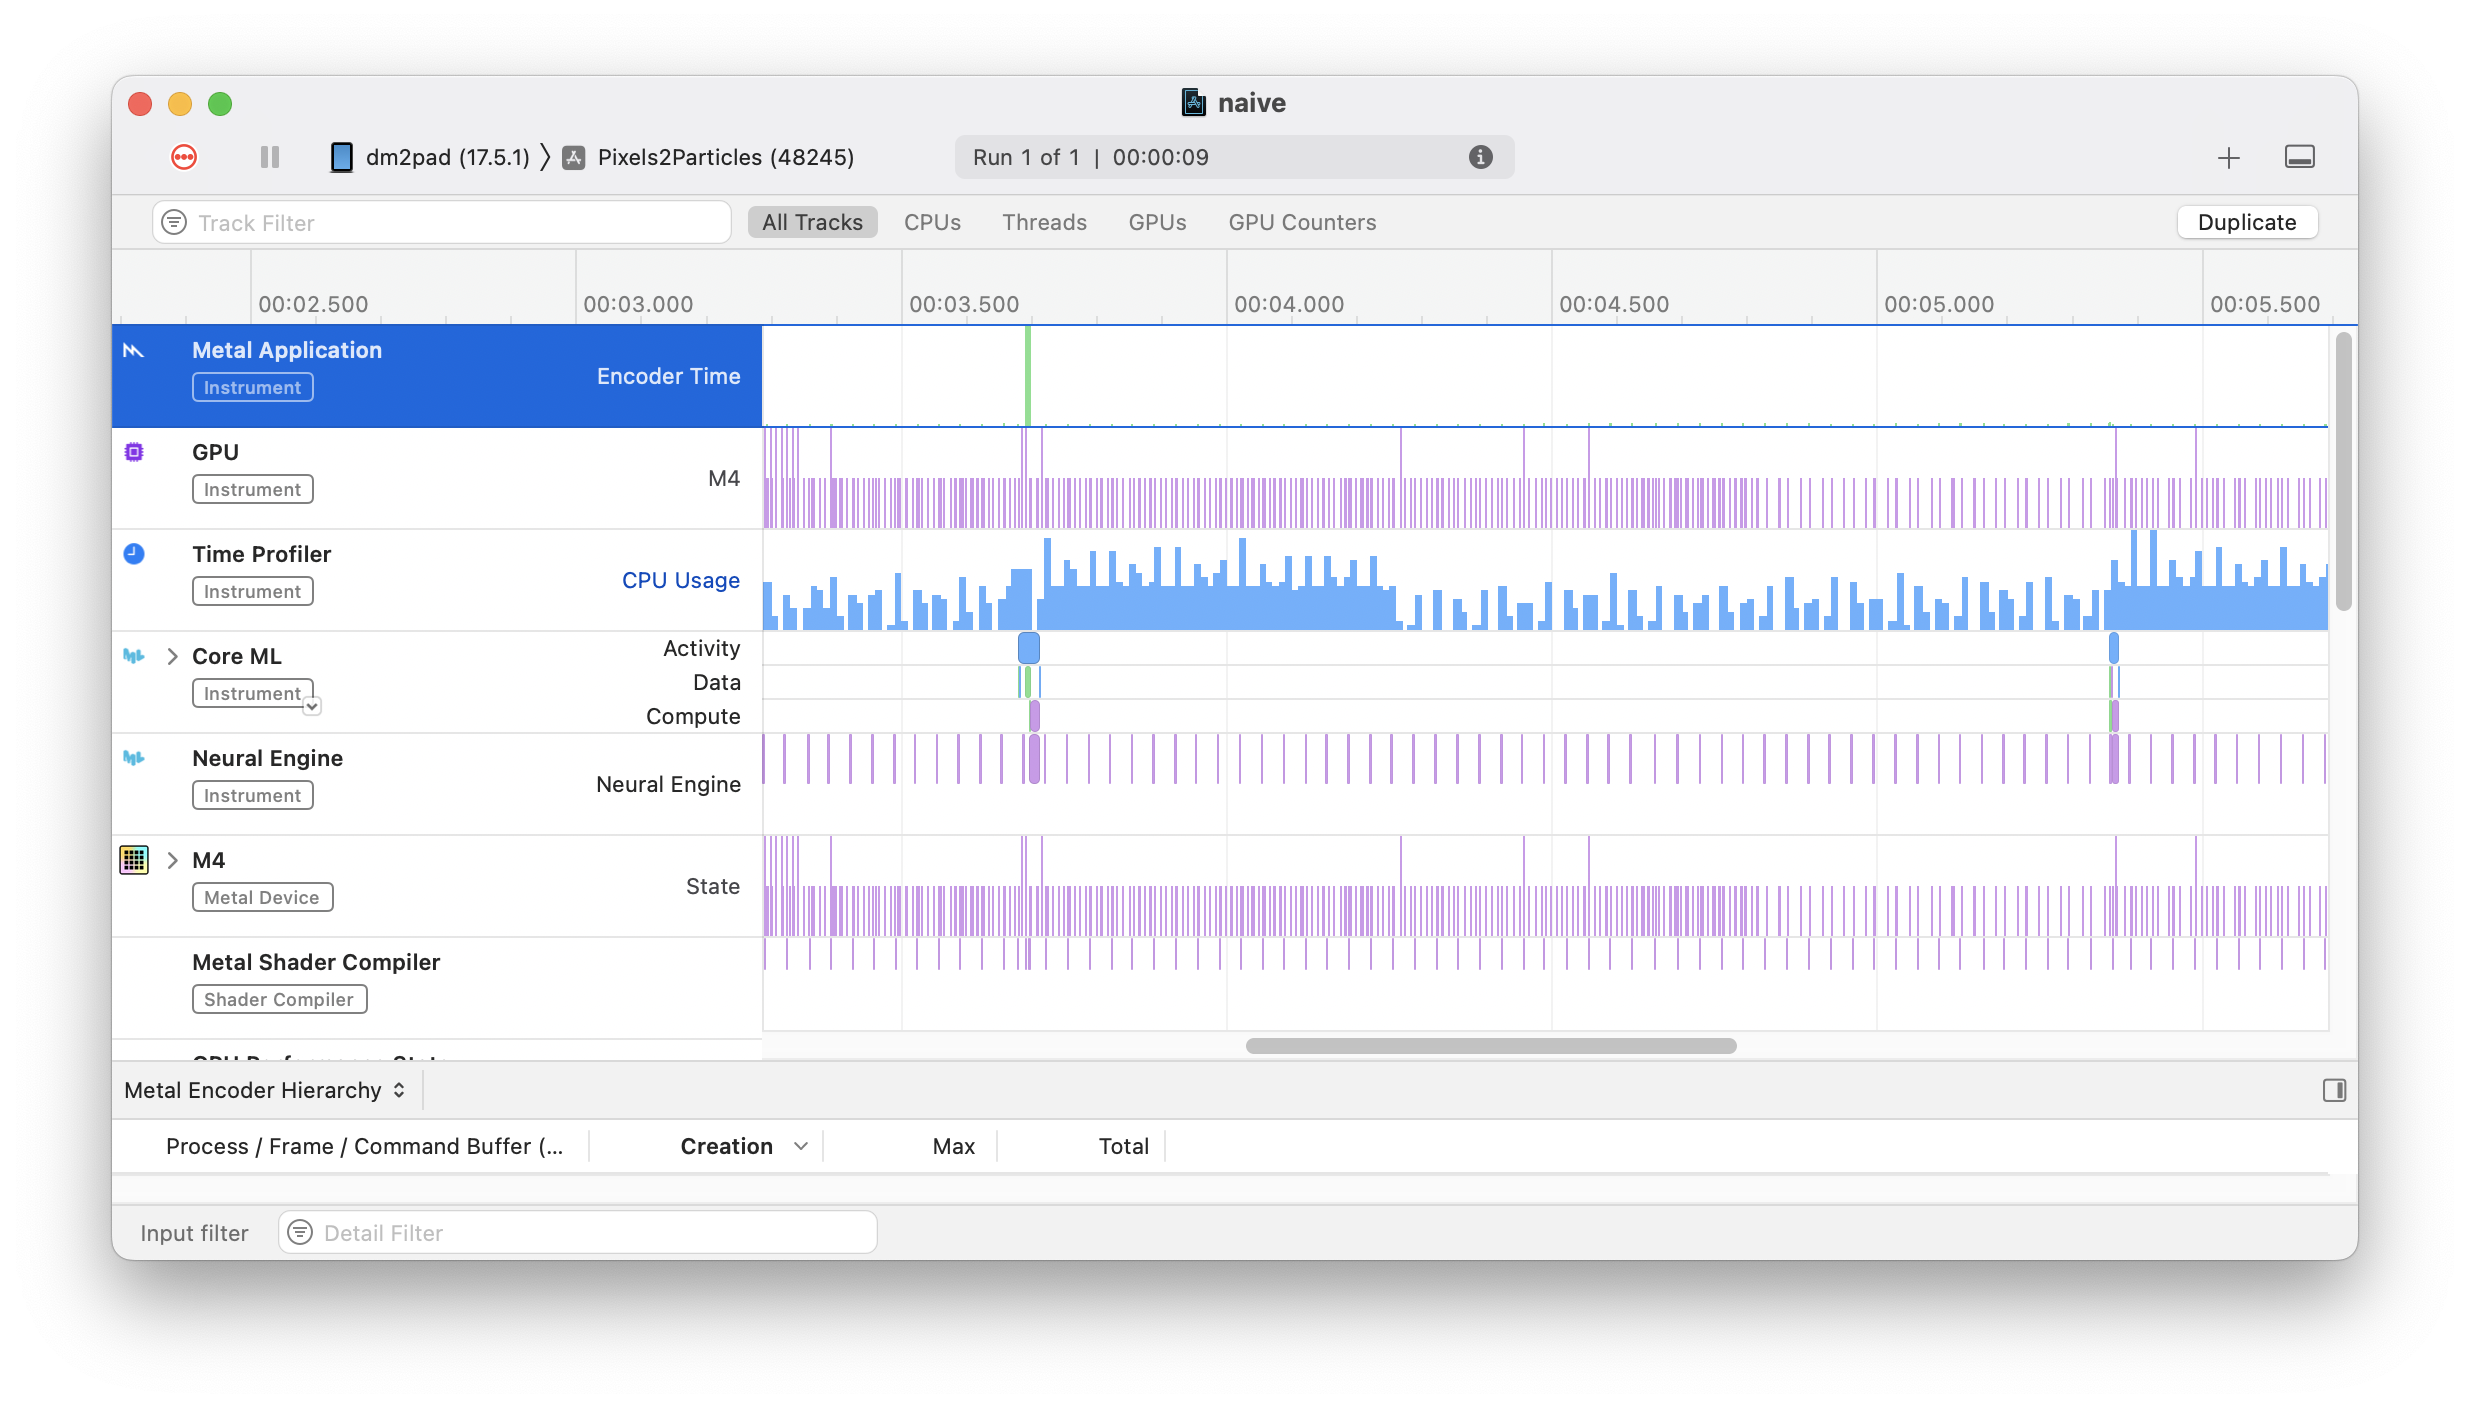
According the Xcode, the model will take no time at all to run a prediction - only 16ms. That’s good enough to run real time! Even on CPU prediction only takes 200ms, that’s good enough for 5 frames per second. This is just a benchmark, not a real test, so you might think that perhaps these numbers are not representative. However, I double checked these results by profiling my app using the “Instruments” tool in Xcode - it remotely profiles the app as it runs and shows where time is spent (and on what compute unit and more: Instruments is awesome!) This profile showed the model taking tens of milliseconds in the neural engine - followed by 0.5-0.7 seconds of high CPU usage - the problem is not the model being slow. The problem is how I’m dealing with the result.

Very little time is spent running the model, but see that spike afterwards? That's my bad.
Inference details
Let’s take a look at how we use the YOLOv8 model via CoreML. For detection-only modes, the CoreML package includes non-max suppression (NMS) and the output from the model is a series of classified boxes. However, for segmentation tasks, the NMS operation is not included and the model output is “raw” results: 32 prototype masks (160x160) and a set of 8400 detections each with a box, some class probabilities and weights for the mask prototypes. This is the same output you get if you run the torchscript exported model:
from ultralytics import YOLO
import torch

model = YOLO('yolov8l-seg')
model.export('torchscript')

model_ts = torch.jit.load('yolov8l-seg.torchscript')

example_input = torch.zeros((1, 3, 640, 640)) # Default image size is 640x640
detections, mask_prototypes = out = model_ts(example_input)
detections.shape  # [1, 116, 8400]
mask_prototypes.shape # [1, 32, 160, 160]
For both detections and mask prototypes the first dimension corresponds to the number of images in the batch - 1. For detections, the next is (4 box points) + (80 classes) + (32 prototype weights), and the final depends on the resolution of the image - YOLO looks for boxes in different regions of the image and for 640x640, it finds at most 8400 boxes.
For mask prototypes, it’s much simpler. There are 32 of them per image, and they have resolution one quarter the input resolution (so 160x160 for us here).
I run the CoreML YOLO model via a VNCoreMLRequest and receive results as a VNCoreMLFeatureValueObservation - an object containing MLMultiArrays of the resulting tensors. The detections are in the feature value observation named like /var_\d{4}/ and the mask prototypes are named “p”. The values can be extracted from the array by indexing into it:
// data is the MLMultiArray for the detections
predictions = []
let npreds = data.shape[2].intValue;
for i in 0..<npreds {
    let i = i as NSNumber;

    // First 4 are boxes
    let box_points: [Float] = (0..<4).map({ j in
        data[[0, j as NSNumber, i]].floatValue
    });

    // Next 80 are confidence scores
    let scores: [Float] = (4..<84).map({ j in
        data[[0, j as NSNumber, i]].floatValue
    });

    // Next 32 are mask weights used to create the final mask from the prototype masks
    let mask_weights: [Float] = (84..<116).map({ j in
        data[[0, j as NSNumber, i]].floatValue
    });

    preditions.append((box_points, scores, mask_weights))
}

predictions = nonxmax_suppression(predictions)
For the mask prototypes it’s quite involved: we need to multiply each of the masks by the weight and sum them up to obtain the overall mask for that detection. This is nice because it means the model only has to generate 32 masks, but it means we’ve a lot of work to do in post processing.
// proto is the mask prototype MLMultiArray
// weights is an array of Float
// x1, y1, x2, y2 are the bottom left and top right corners of the box
assert(weights.count == proto.count)
let merged = (y1..<y2).map({r in
    (x1..<x2).map({c in
        (0..<n).reduce(0.0, {(running, i) in
            running + (weights[i] * proto[i][r][c]
        )}
    )}
)})
With the detections found and masks for each detection obtained, we can now draw the segmentation on the input image. Swift has a great graphics library so this is really easy:
// instances is a list of an class wrapping up the data and including some helper functions.
let renderer = UIGraphicsImageRenderer(size: CGSize(width: 640, height: 640))
let shape = CGRect(x: 0, y: 0, width: 640, height: 640)
let seg_image = renderer.image { context in
    original_image.draw(in: shape)
    for (i, instance) in instances.enumerated() {
        // NOTE: mask is one quarter the size of the bbox
        let mask = mask_proto.get_mask(for: instance)

        let colour = Prediction.COLOURS[i % Prediction.COLOURS.count]
        context.cgContext.setLineWidth(3.0)
        context.cgContext.setStrokeColor(colour.cgColor)
        context.cgContext.addRect(instance.box.as_cgrect())
        let mask_im = mask.as_cgimage(colour: colour)
        let mask_uim = UIImage(cgImage: mask_im)
        mask_uim.draw(in: instance.box.as_cgrect())
        context.cgContext.strokePath()
    }
}
These are the three main things that are being done post-inference.
An Accelerate side track leads to the finish line
I searched around and found the Accelerate library for performing high performance vector and matrix operations - could this be the answer?
The relevant are organised into vDSP and vForce namespaces. These include functions for quickly performing argmax (useful for finding the class label of a detection) and elementwise addition and subtraction. However, these all operate on plain arrays of Floats (or Doubles). So before going any further, I need to convert an MLMultiArray into [Float]. There’s no handy method or constructor to help me here, but an online search got me this StackOverflow answer:
var a: [Float] = [ 1, 2, 3 ]
var m = try! MLMultiArray(a)

if let b = try? UnsafeBufferPointer<Float>(m) {
  let c = Array(b)
}
It’s horrible and seems hacky to need to use anything named Unsafe... but it works. As the matrix is now flattened, we need to index it differently. Instead of indexing by each dim, we need to create the overall index by multiplying each dim by the stride after it. So for the detections:
let det = ... // MLMultiArray of shape [N, H, W]

// OLD:
var v1 = det[[i, j, k]]

// NEW:
var v2 = det[i*H*W + j*W + k]
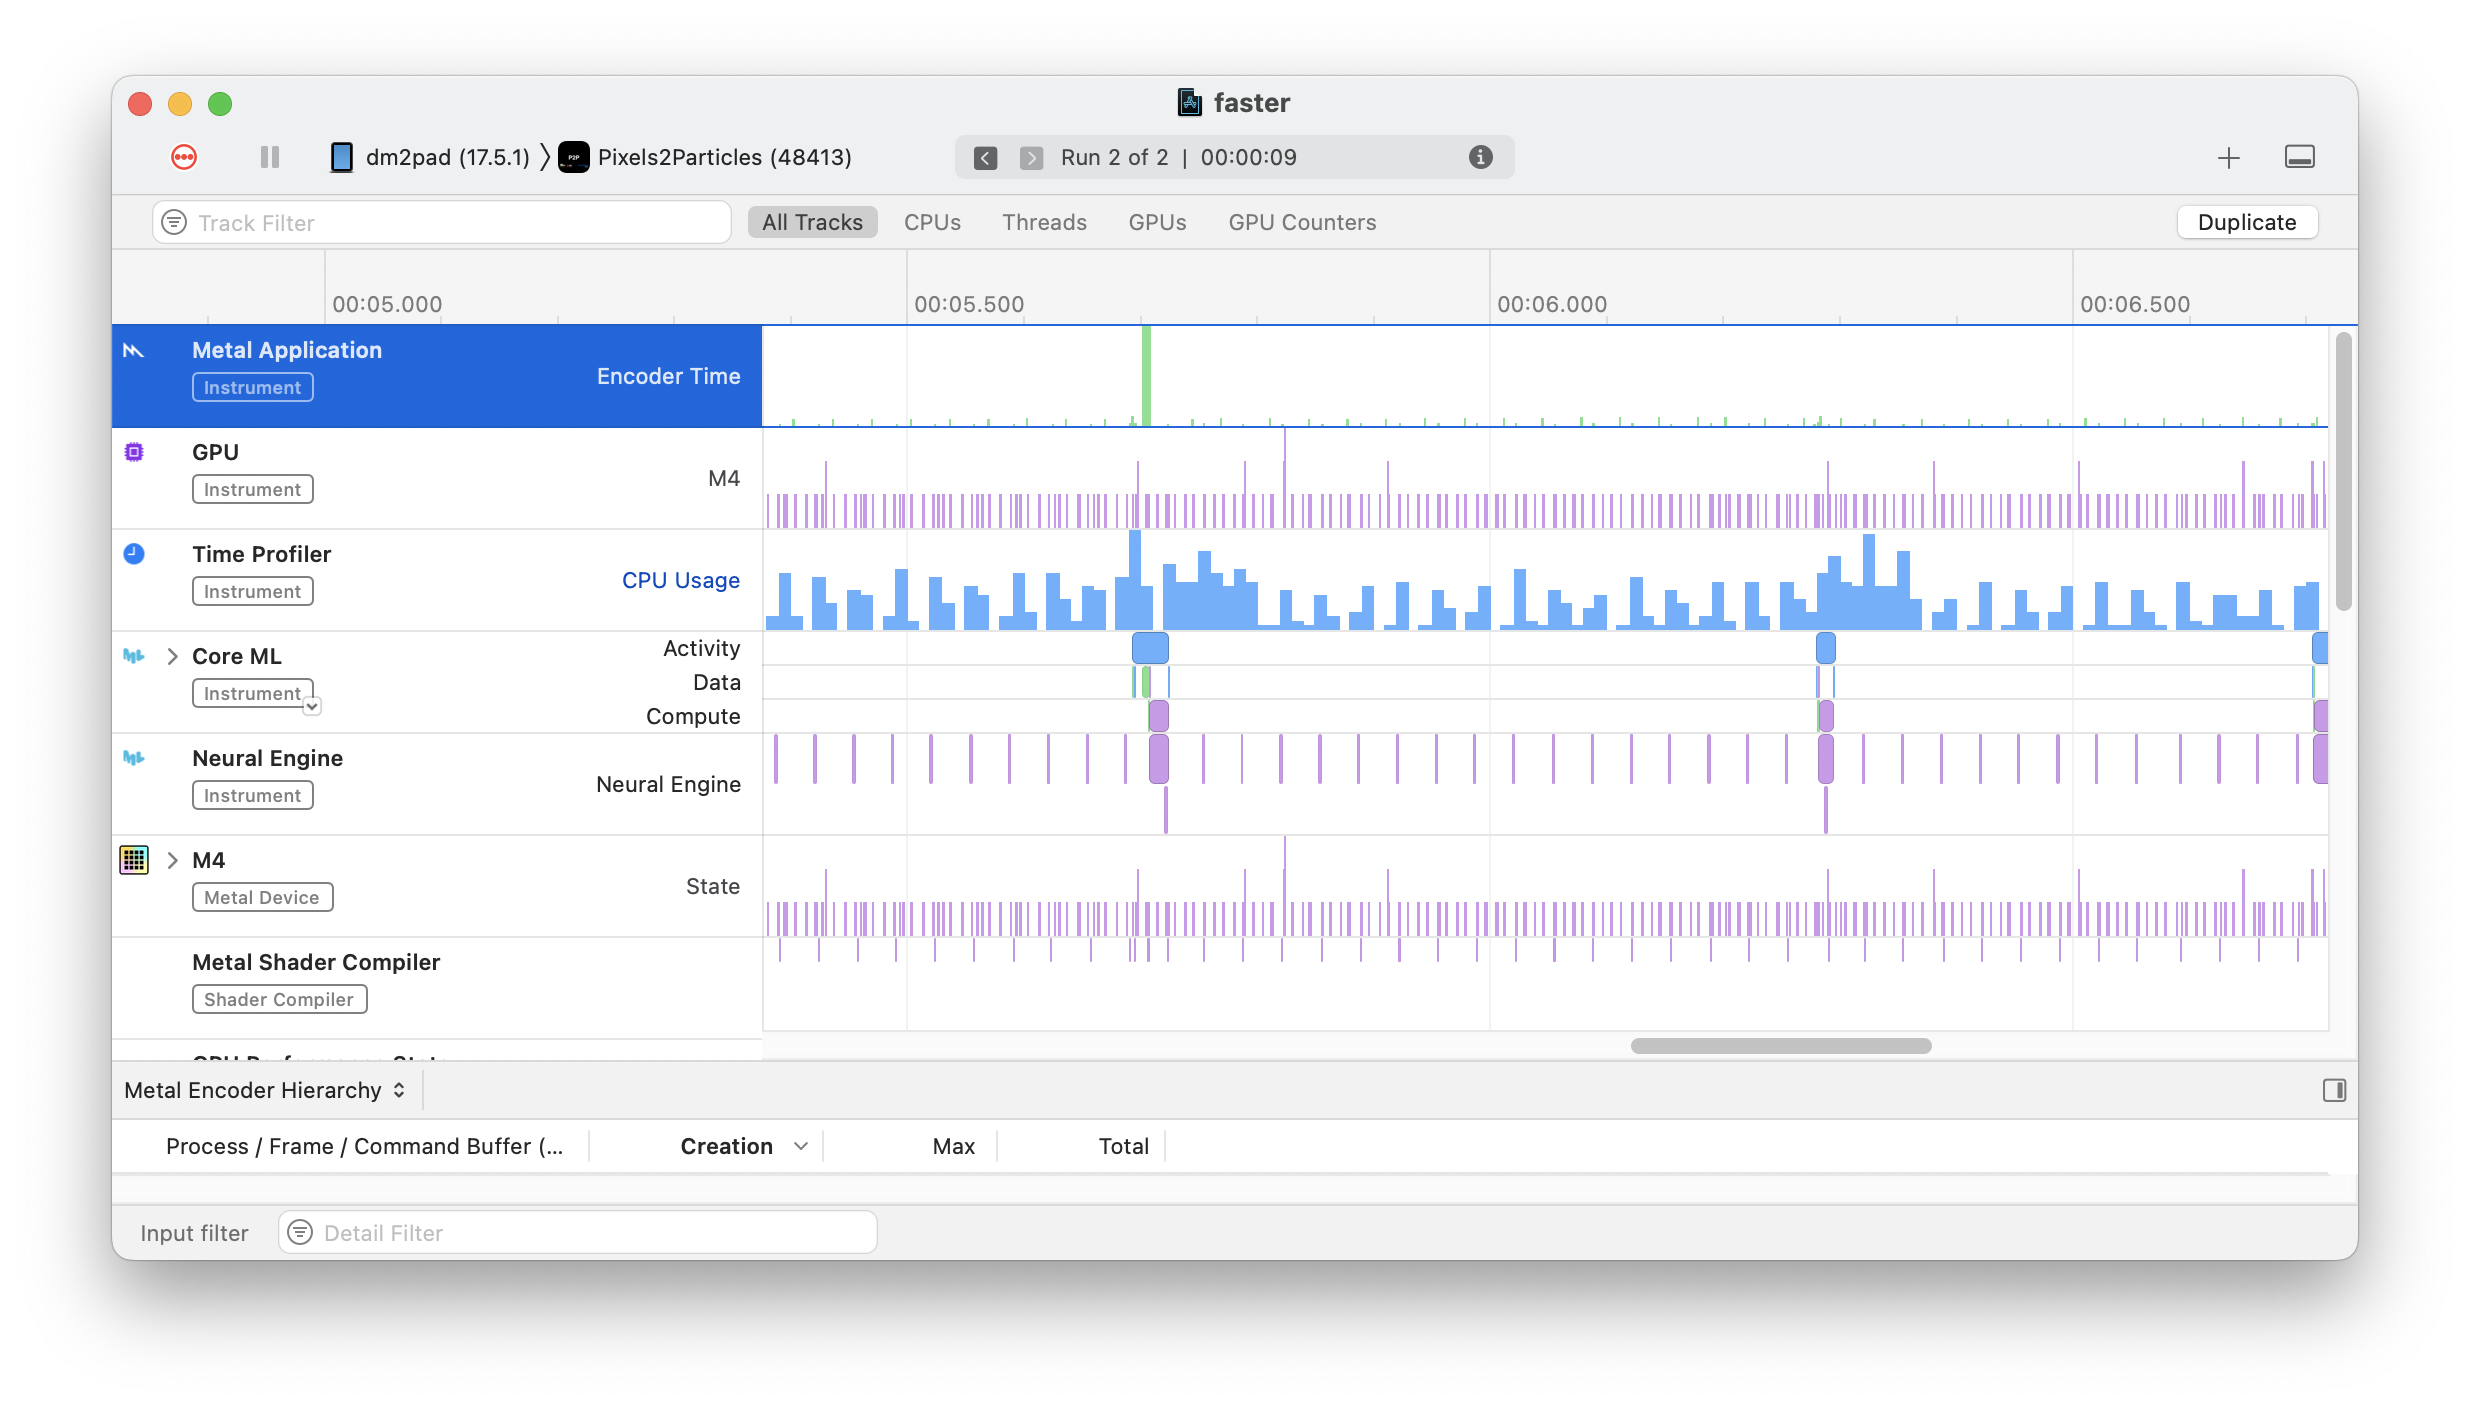
I changed this up in the detections and mask proto functions and gave it a test to see if it worked okay and… lightning fast.

Changing the way I index was all it took.
That was it, that’s all I had to do to get an insane 10x speed up: from 500ms to 50ms. I don’t know what is happening in the MLMultiArray class or when indexing it by each dimension but it is absurdly slow. Moving to flat arrays is all I needed to do really. I’m still going to look at Accelerate for optimising this further, but my journey getting this app “fast enough” stops here.
Conclusions
Chasing performance is always a fun challenge - especially when you have so many levers to pull. In Swift, there seems to be so many ways of doing each thing, there’s a lot you can change to find better performance in your app. I’ll keep fiddling with this app until I’m happy with it but for now I can say I’ve learned a lot about profiling in Xcode: where to see what improvements can be made.
I’ve also gained an appreciation for the Apple Silicon chip - this thing is pretty great. I can run inference over and over and barely see my battery percentage trickle down. These purpose-built NPUs are great for driving deep learning models efficiently. As these become more popular, I’m becoming more and more worried about how much power is being devote to churning through billions of matrix operations just to suggest the next word in a sentence.
